Recently I tried to improve my swimming skills. I’m trying to get better at longer distances, swimming with less effort, and going a bit faster. In some videos they talked about optimising the amount of strokes you take per minute, and your pace per 100 meter. Apparently there is a certain sweet spot you have to hit, and there are specific actions to take depending on how good your swimming is right now.
Luckily I collected data on my swimming behaviour in the last two years with my Apple Watch. This is all stored on my Apple account. The only thing missing was converting the raw data into an insight.
Because I could not find a good app to give me this insight I decided to analyse the data myself using Python. I got help from Mark Koester, who already wrote code to transform the XML file from Apple into CSV files with the necessary information. The only thing remaining was reading the CSV files, combining the data, and plotting it onto the graph!
The result looks like this:
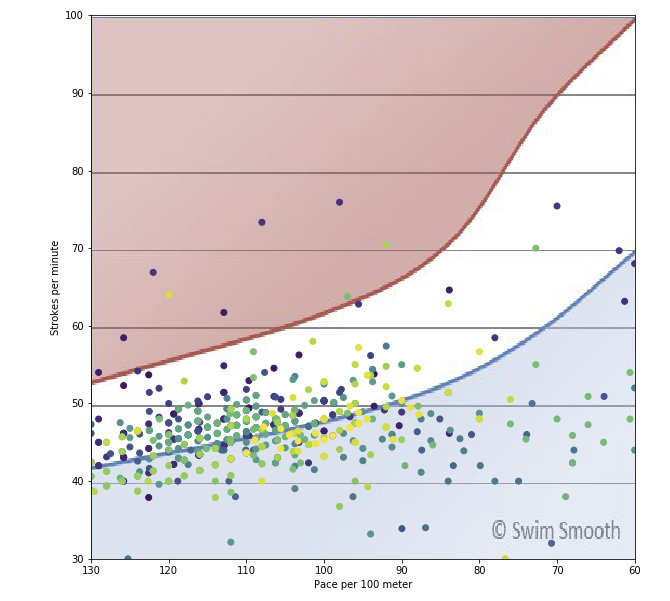
As you can see my strokes per minute is a bit too slow for the pace I’m going. Next months I will work on increasing that for sure! Brighter dots are newer swims, and you can kind of spot a gradient. It’s good to know that I’m already progressing to the right, meaning my time to swim 100 meters is already decreasing over the last three years. Fantastic 🥳.
Do you have your own data? I made my code open source: https://github.com/rmeertens/swim_stroke_analysis/blob/main/Analyse%20stroke%20rate%20vs%20pace.ipynb. The code is simple to understand and to modify, so hopefully it helps you a lot. Let me know if you gain any valuable insights.