A little over a year ago my girlfriend Lisette and I moved in together. A big part of living together was getting used to managing a budget, and knowing where our money went. Lisette made one of the coolest Excel spreadsheets I ever saw, the only thing we needed to do was… actually fill in what expense belongs to what category. This is where things went wrong…Every month we have about 100 shared expenses, and labeling them turned out to be a boring job we both didn’t want to do (and thus ignored for the last 10 months…). Last weekend I made an attempt at automating this task using the power of machine learning!
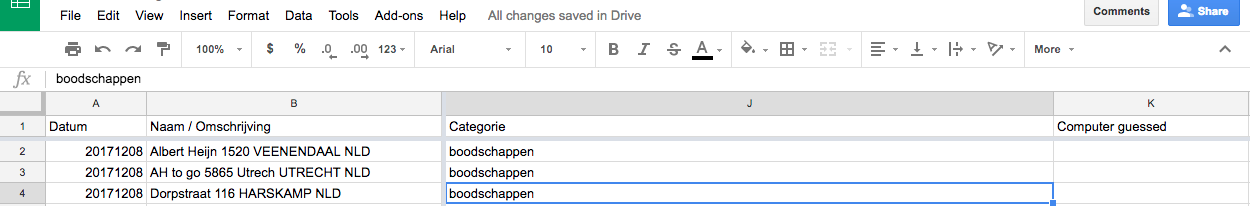
The first step to training a classifier is getting your training data! My bank gives you the option to download a spreadsheet with all (unlabeled) expenses. I imported this into a Google spreadsheet and added two columns: one with my own (optional) labels and one for the computer-generated labels.
Getting Excel data into Python
Although writing a classifier in Excel is probably possible I used Python with the NLTK and SKLearn library. To do this I needed to get all transactions and labels I added in my Jupyter Notebook. Thanks to Greg Baugues this turned out to be surprisingly easy! His blog post was a great help, and made this process pretty smooth.
import gspread
from oauth2client.service_account import ServiceAccountCredentials

creds = ServiceAccountCredentials.from_json_keyfile_name('google_account.json', ['https://spreadsheets.google.com/feeds'])
client = gspread.authorize(creds)
temp = client.open("rolands budgetvariant")
sheet = temp.worksheet("ALLES")
For each transaction, I made a feature vector with a boolean for each of the most common words in the transaction. I made separate lists for words in the description, the number of the account money was transferred to, and whether we receive money or not.
import nltk
def get_freq_dist_for_sheet(sheet, key, max_words=30):
    records = sheet.get_all_records()
    words = list()
    for record in records:
        words.extend(w.lower() for w in record[key].split())

    all_words = nltk.FreqDist(words)
    word_features = list(all_words)[:max_words]
    return word_features

interesting_features = ["Naam / Omschrijving", "Tegenrekening", "Af Bij", "Mededelingen"]
freq_dists = dict()
for feature in interesting_features:
    freq_dists[feature] = get_freq_dist_for_sheet(sheet, feature)
def record_features(record, key, doc_features):
    document_words = set(w.lower() for w in record[key].split())
    features = {}
    for word in doc_features:
        features['contains({},{})'.format(key,word)] = (word in document_words)
    return features

def all_record_features(record):
    input_data = dict()
    for categorie_name in freq_dists:
        ## dict.update means that you merge dictionaries
        input_data.update(record_features(record, categorie_name, freq_dists[categorie_name]))
    return input_data

def get_traindata(sheet):
    records = sheet.get_all_records()
    traindata = list()
    for record in records:
        if record["Categorie"]:
            input_data = all_record_features(record)
            traindata.append((input_data, record["Categorie"]))
    return traindata
training_data = get_traindata(sheet)
all_labels = set([x[1] for x in training_data])
print("Training with " + str(len(training_data)) + " entries")
print(all_labels)
After selecting all the transactions I labeled, and converting them to these feature vectors I could select and train a classifier! I decided to go for a simple decision tree. Not only did I expect this to work reasonably well for my features (only recognizing where I do groceries and who I pay my rent to would remove 80% of transactions I normally have to label!). Conveniently the NLTK library I used to create the frequency distribution also contains a class that allows you to import any SKLearn classifier. This reduced training to one line of code
from nltk.classify import SklearnClassifier
from sklearn import tree

classifier = SklearnClassifier(tree.DecisionTreeClassifier(), sparse=False).train(training_data)
Visualising the decision tree
The SKLearn tree classifier has a function to write the decision tree as a graphviz file. This function requires the classifier NLTK created, the feature names, and the class labels. Getting these required a bit of documentation reading as there are no clear functions to get these (and there is no way to know what the classifier did with your data). Eventually, the following code was able to get what I needed. Python can even write the whole tree itself if you install and import the graphviz library.
import graphviz

dot_data = tree.export_graphviz(classifier._clf, out_file=None,
                         feature_names=classifier._vectorizer.get_feature_names(),
                         class_names=classifier.labels(),
                         filled=True, rounded=True,
                         special_characters=True)
graph = graphviz.Source(dot_data)
graph.render("budget_decisiontree")
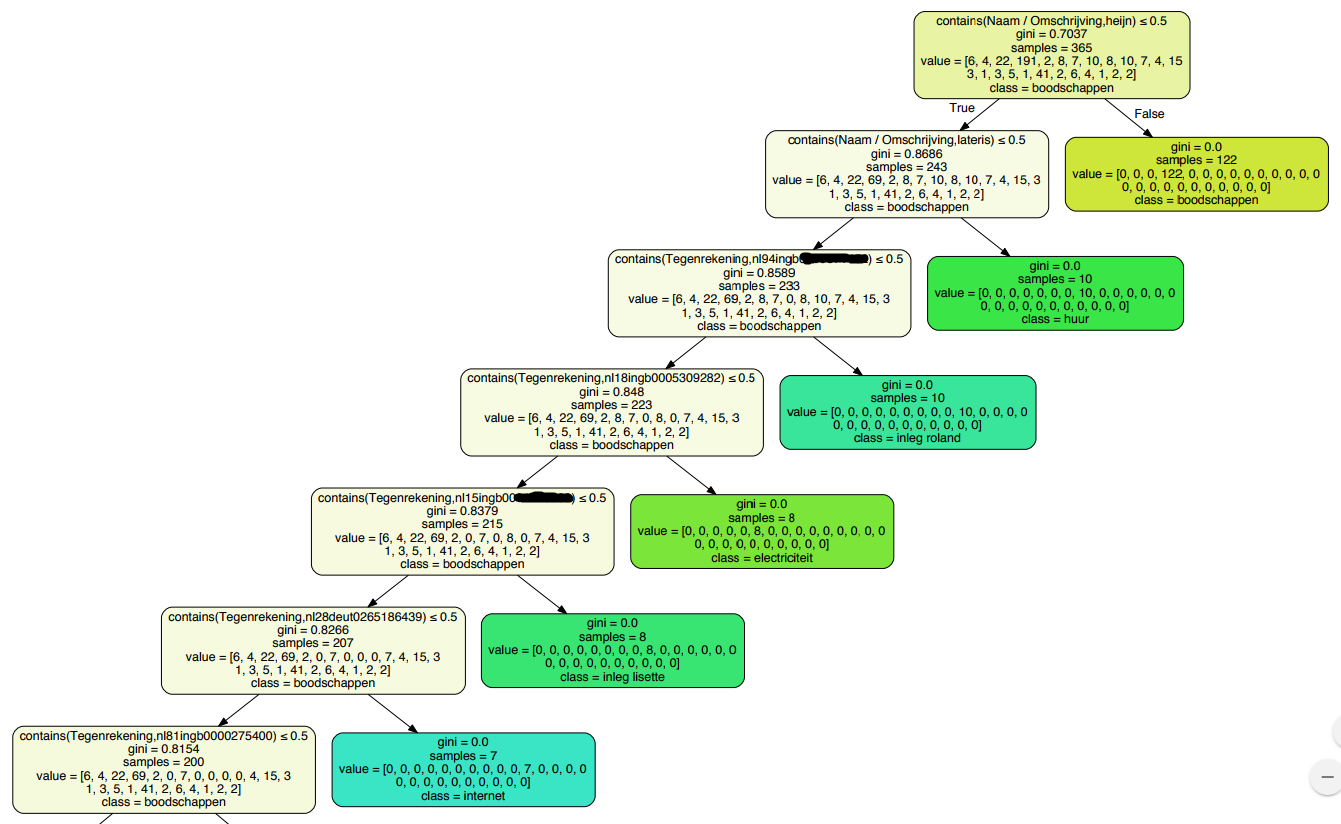
Below is a part of the decision tree the algorithm generated. It correctly discovered that I do my grocery shopping at the “Albert Heijn” (https://www.youtube.com/watch?v=GiZJa_Ctkr4), where I rent my apartment, where my internet money goes to, and much more!
Labeling data
And now the most important part of this project: classify each of my transactions! As described at the start of this article I added a column for the computer prediction. The Google Sheets API allows you to write a single cell at a time which for some reason takes around a second per edit. Although it’s annoying if you try to iterate quickly, it gives some cool visualizations while your algorithm is working!
records = sheet.get_all_records()
for row, record in enumerate(records):
    try:
        row += 2 # rows start at 1... first row is a header
        input_data = all_record_features(record)
        but = classifier.classify(input_data)
        if but != record["Computer guessed"]:
            sheet.update_cell(row, 11, but)
    except Exception as e:
        print("Exception at row " + str(row))
Conclusion
Although not everything is filled in correctly, about 80% of my transactions are now correctly labeled! It saved me a lot of time, was an interesting challenge, and makes the awesome Excel sheet way more usable now.
If you are interested in the code, it’s available on Github: https://github.com/rmeertens/python_budget_classifier . I always love to hear feedback from people so please reach out to me!
Looks interesting. The main issues I see in understanding the method are: 1) where did you make the “vector of booleans”? 2) IMHO, non-English terms make very difficult to understand the results to non-native language readers.
In which format your dataset present?