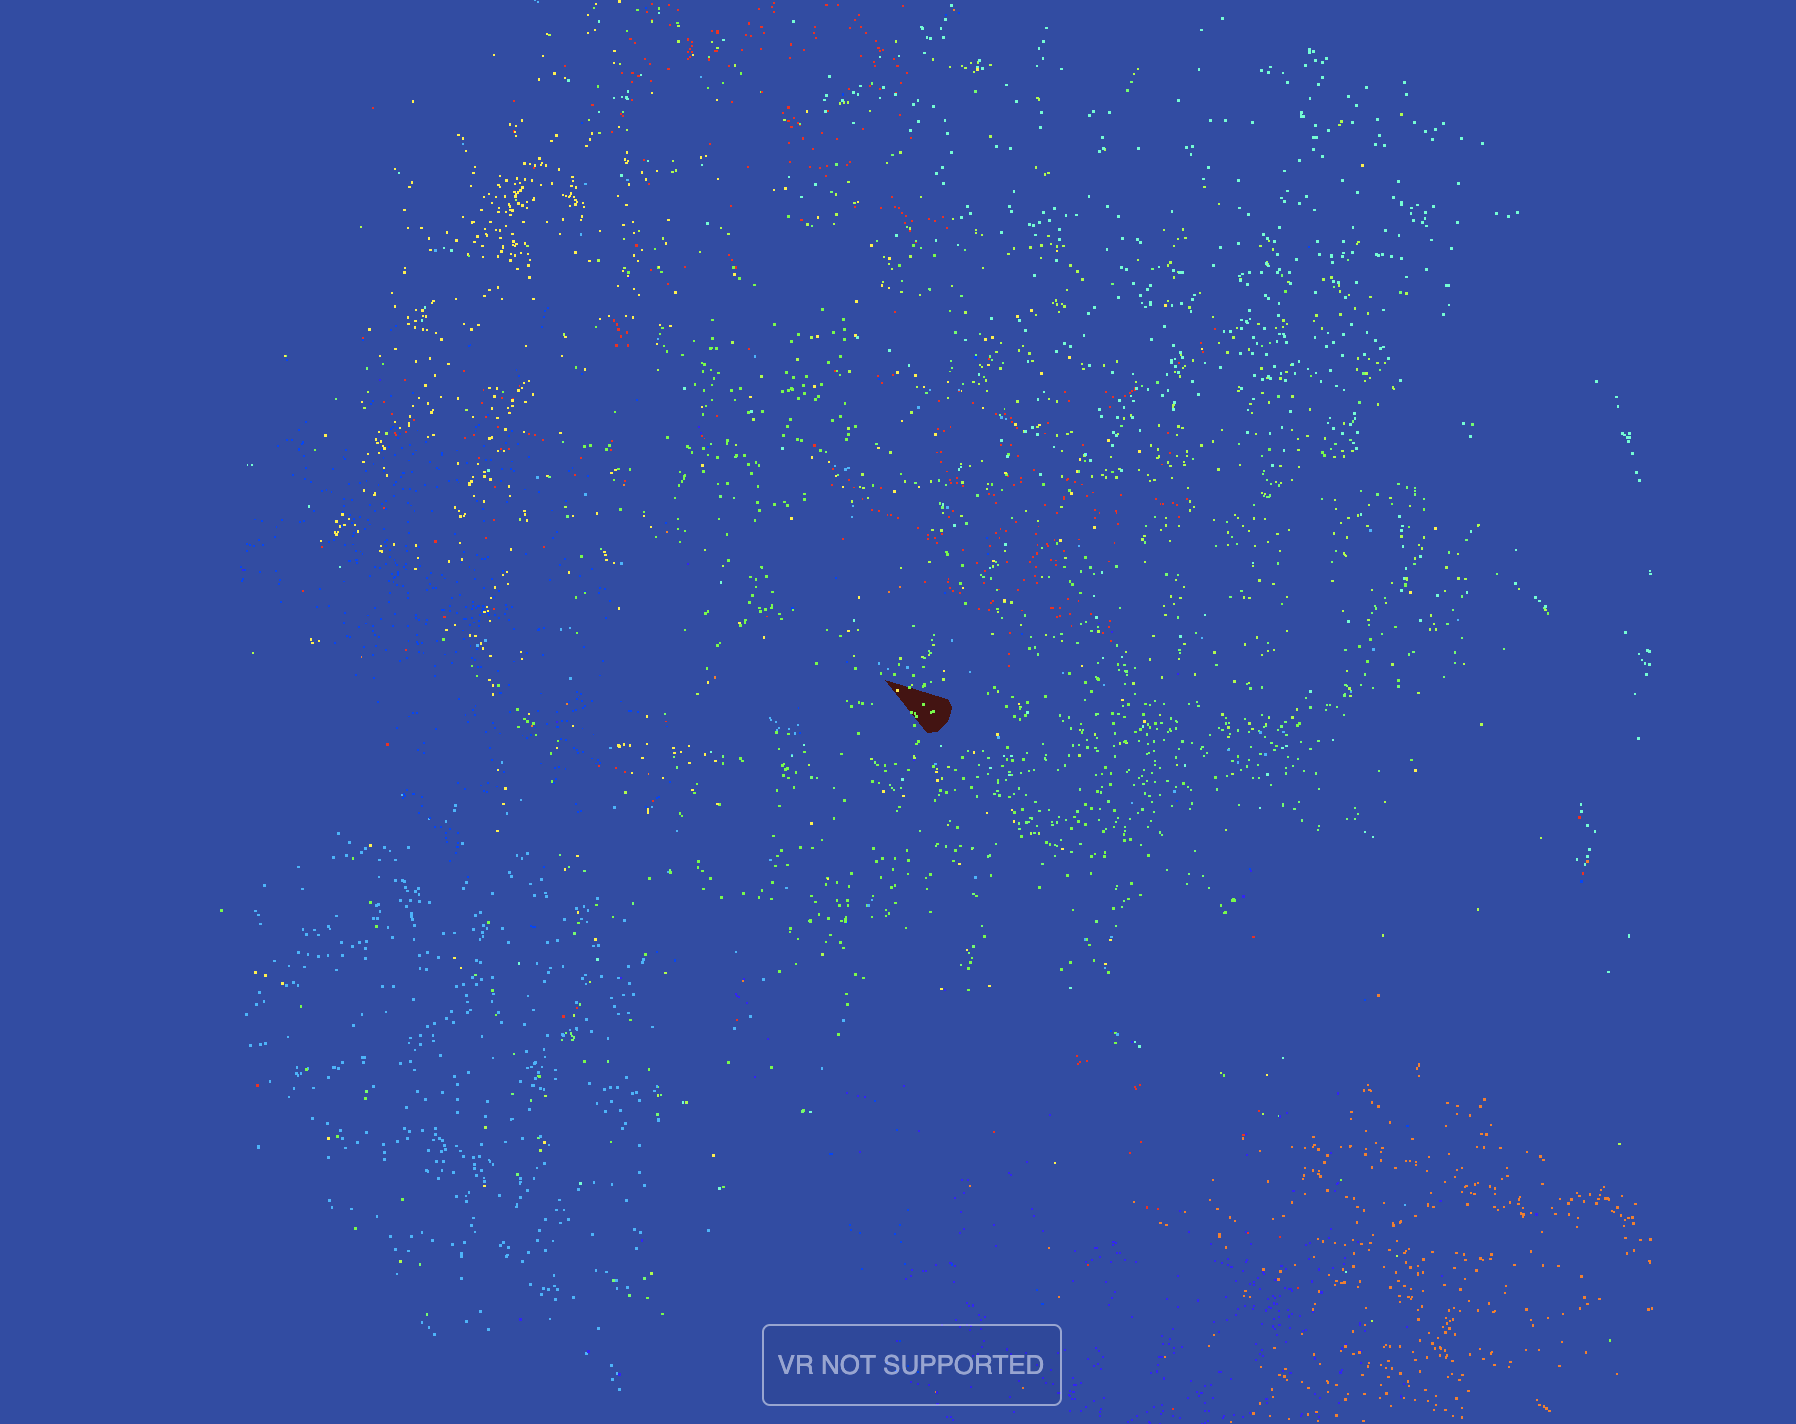
When working with data and neural networks it’s good to know whether similar data is close together. This could be either in the original space of the data or in a deep layer of a neural network. In the last case, we call the data an “embedding” (most well-known for word embeddings). As humans like to look at data in two or three dimensions people often project data down in this space. I wanted to show that it’s possible to walk through your data using virtual reality using the Immersive Points app I programmed over the last month.
Embeddings are so important that the visualisation of them is by default included in Tensorboard, that you can view and upload them on this site as well, and that how to do this easily is one of my most popular blog posts. As for how to visualise the data: you can either use PCA or T-SNE, where T-SNE often finds interesting clusters which give some insight into how separable your data is.
To see the results directly in 3D, you can go to this page. You can also look at the code used to produce this on my GitHub page.
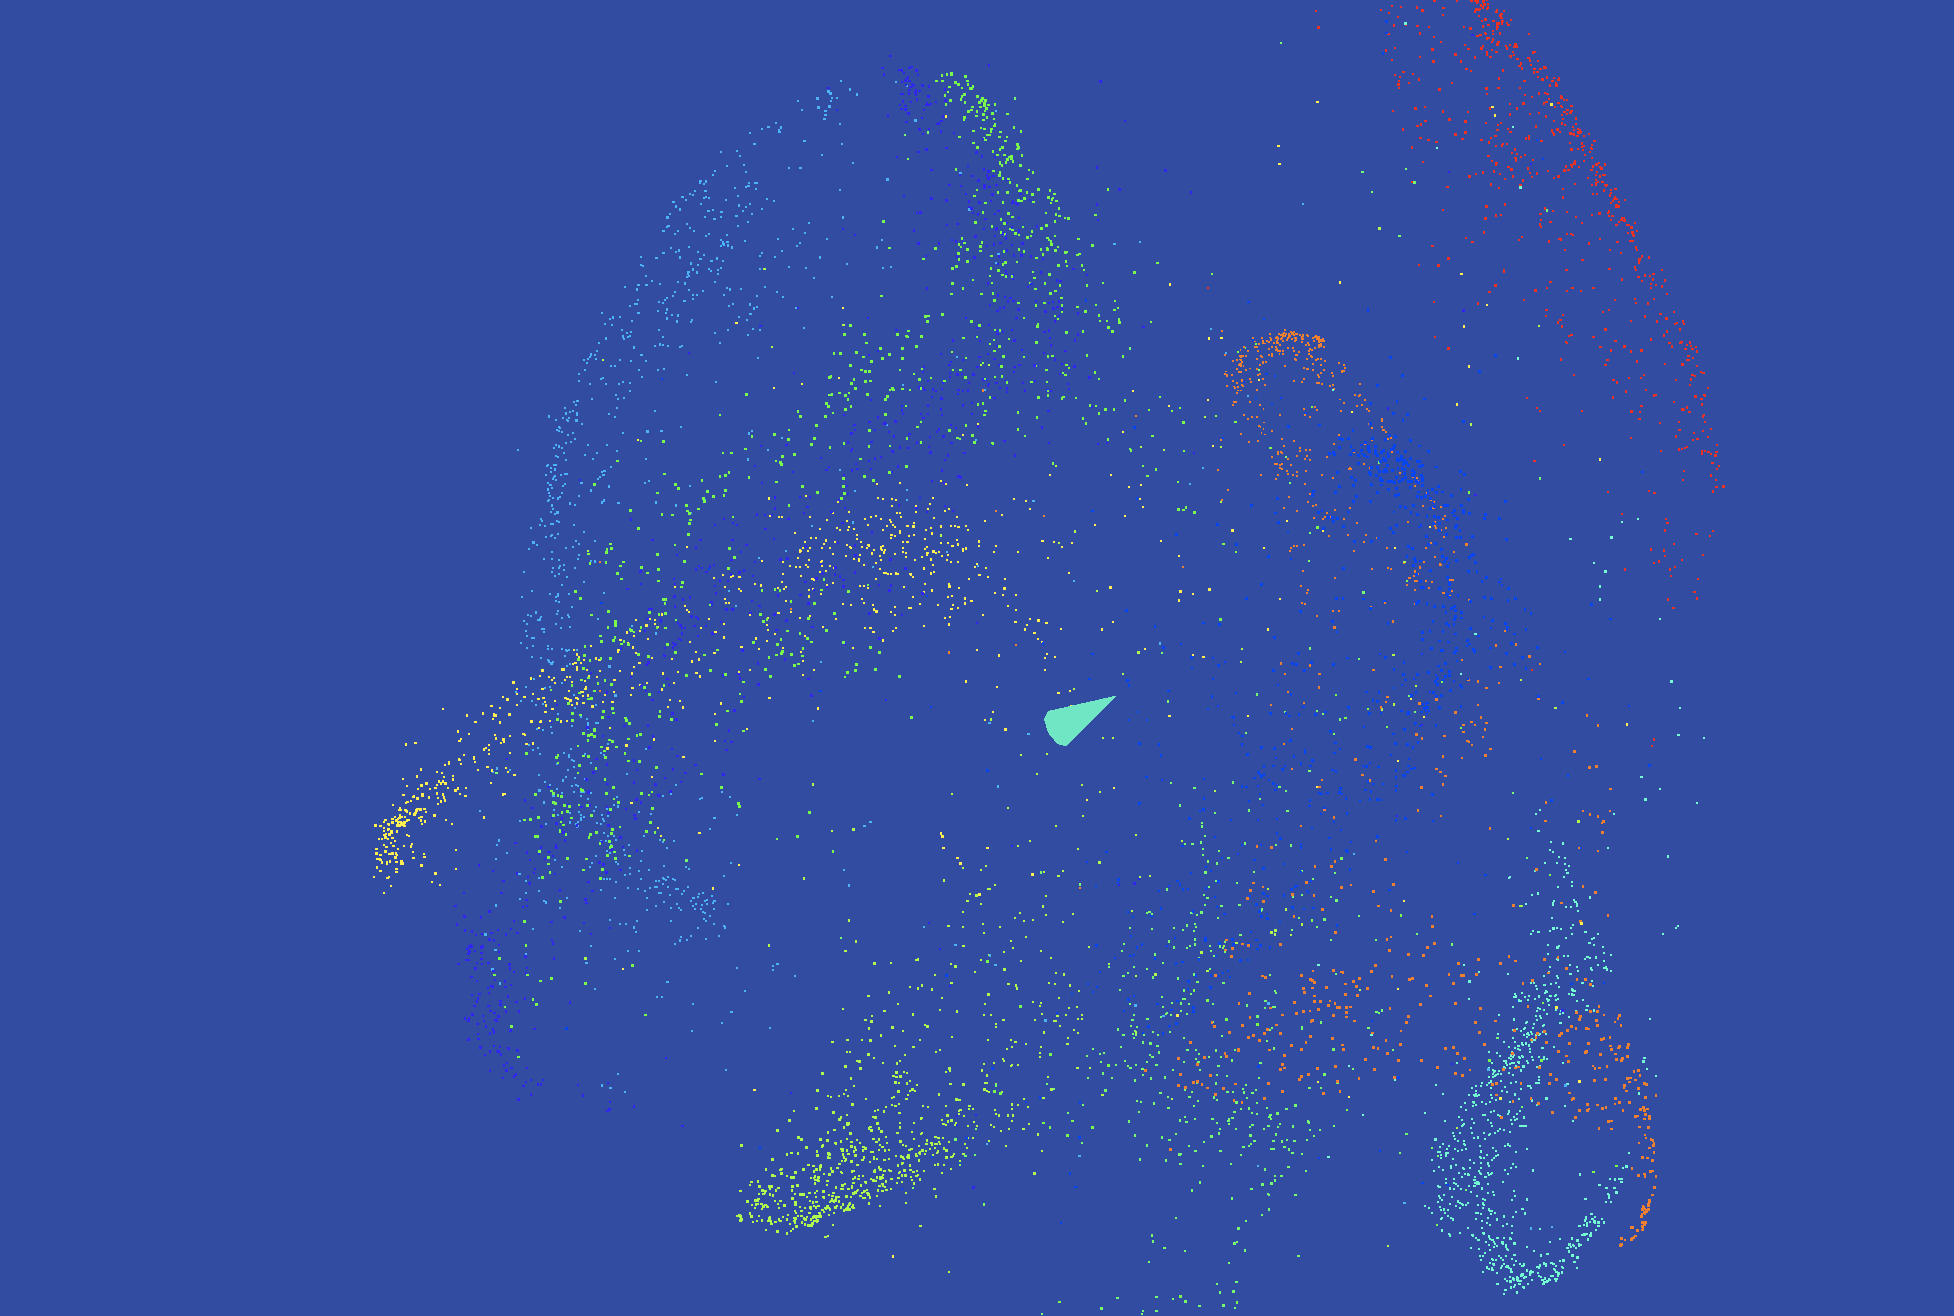
Update: In the MNIST example it’s actually a bit lame that you visualise the representation of the digits directly. This doesn’t seem to be possible with CIFAR10, which has a much more interesting range of representations of objects. In fact, Laurens van der Maaten challenges people to look at the neural network representation of CIFAR10 in his tech talk at google 6 years ago (which is a great recommendation if you want to learn how t-SNE “learns” the visualisation). I made a simple neural network and visualised a 512 dimensional embedding space using t-SNE and uploaded it to my site. You can see the result here: https://rmeertens.github.io/ImmersivePoints/oculus.html?name=0c8b60de-cb28-46cc-b580-f255ed72f3d6.xyzi .