Last week someone pointed out the Astyx dataset to me. So far I only visualised lidar data in my virtual reality tool immersivepoints.com, so I was interested in seeing how radar could be integrated as well.
The Astyx dataset is provided by what is now Cruise. The dataset can be downloaded for free, and contains data from three sensors:
- A 16-line Velodyne lidar puck
- A camera
- And of course their own developed radar
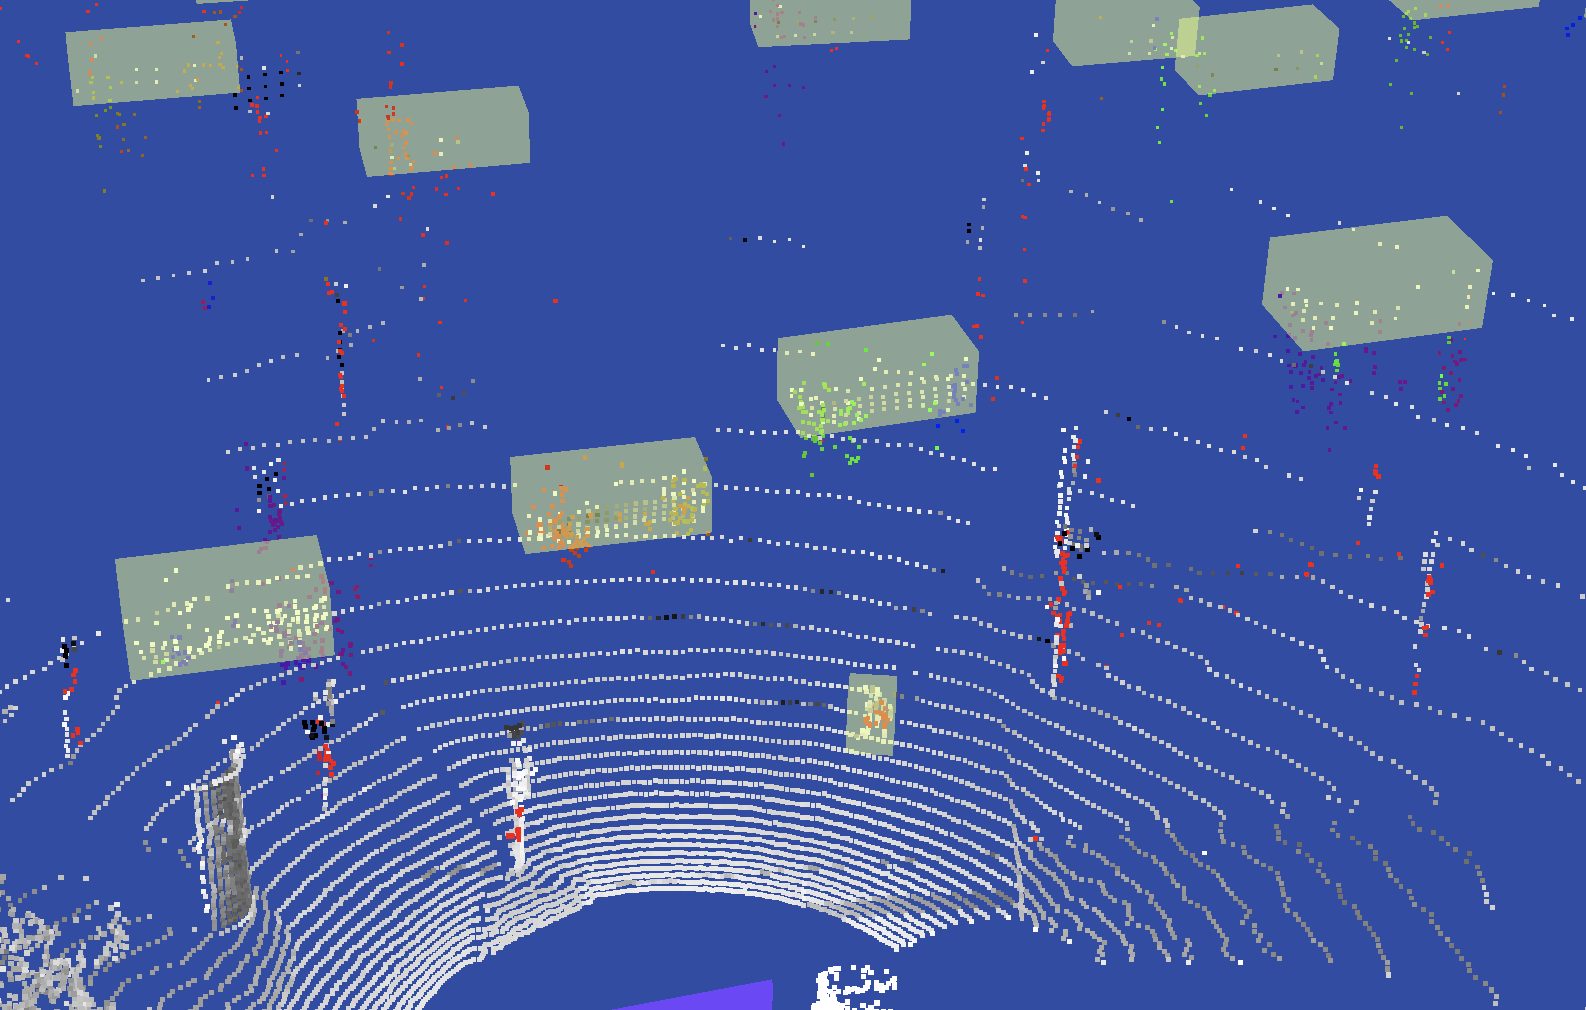
It also contains bounding box annotations of all objects that can be observed by the lidar, camera and radar. This is the visualisation the authors of the dataset use in the paper “Automotive Radar Dataset for Deep Learning Based 3D Object Detection“.
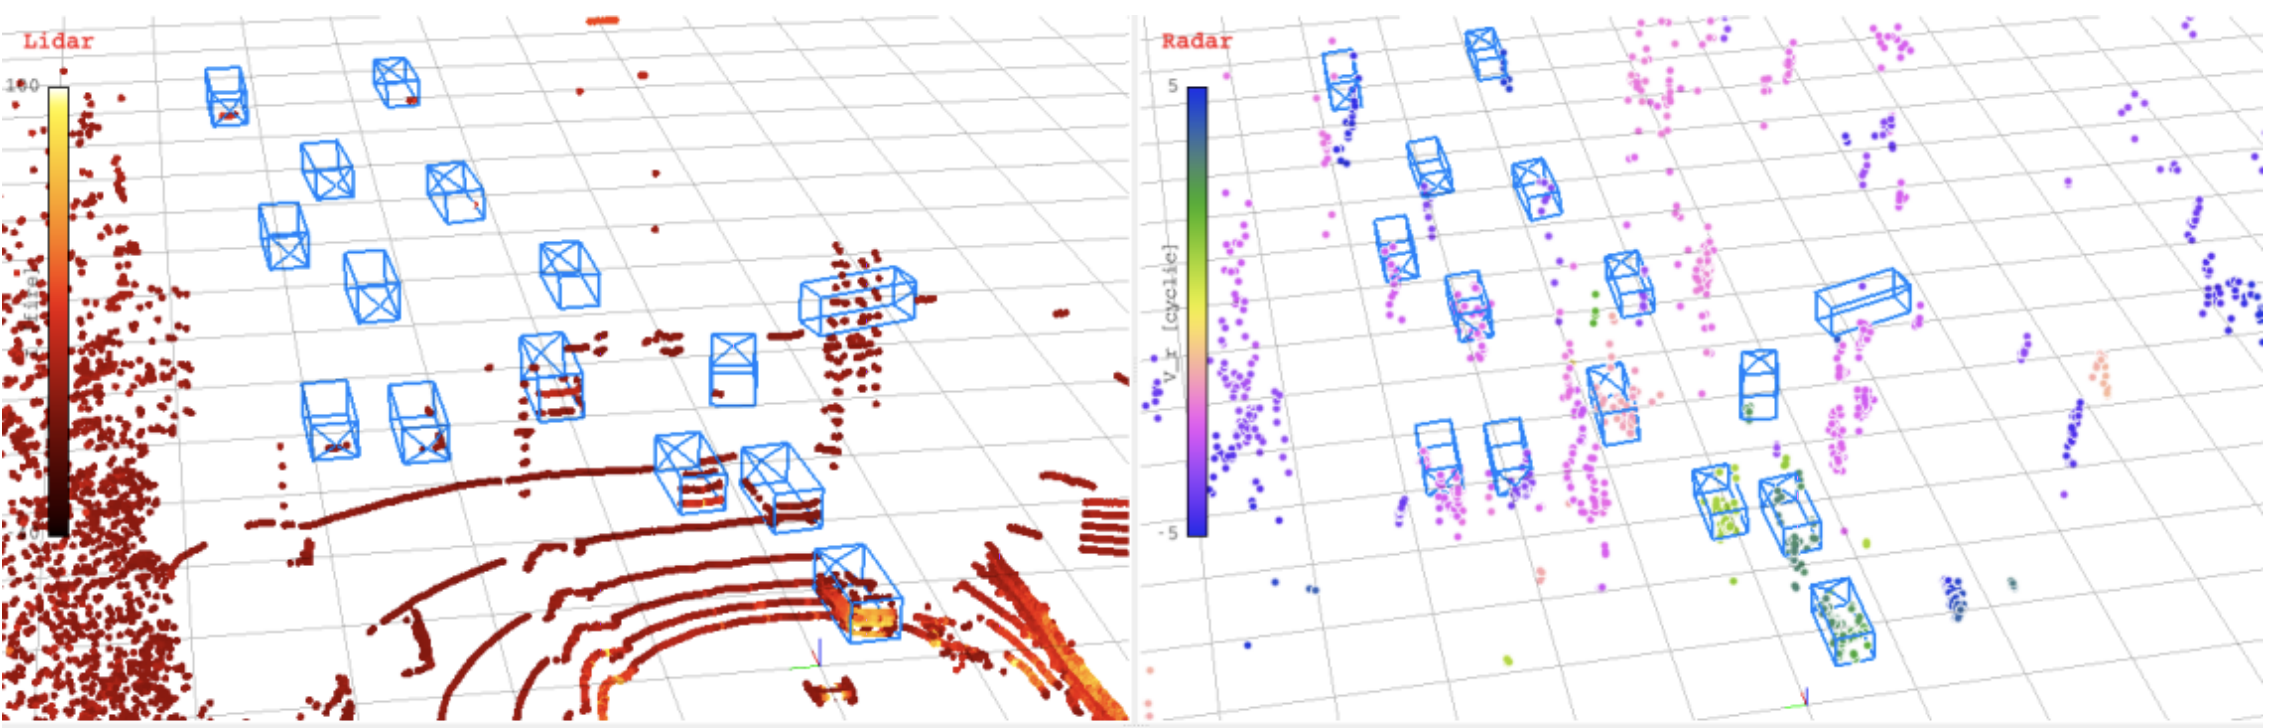
Loading the lidar data and visualising it in virtual reality is really easy with an Oculus Quest and immersivepoints.com. Visualising two sources of data required a bit more experimentation. The challenge of any data visualisation is finding a representation which shows the properties you care about. In the case of lidar data this is most likely the intensity of each point, as this says something about how reflective a surface is (and thus allows you to see license plates on cars and lane markings on the road). For radar you could visualise the radial velocity (in the direction of the radar sensor), or the magnitude with which the radar waves return. For self-driving cars it’s most interesting to know the (radial) velocity of road-users around you, so I chose to visualise that.
Now that we know what we want to visualise the last challenge is finding a good representation for the two things. In the end I chose to make lidar white (non-reflective) to black (very reflective) and make radar between blue (going away from us), through red (low velocity) to green (coming towards us). You can now know the direction cars on the road are going by simply looking at the colour of the radar points, something you couldn’t do with only the lidar points.
If you want to see the results of the visualisation, take a look at the following links:
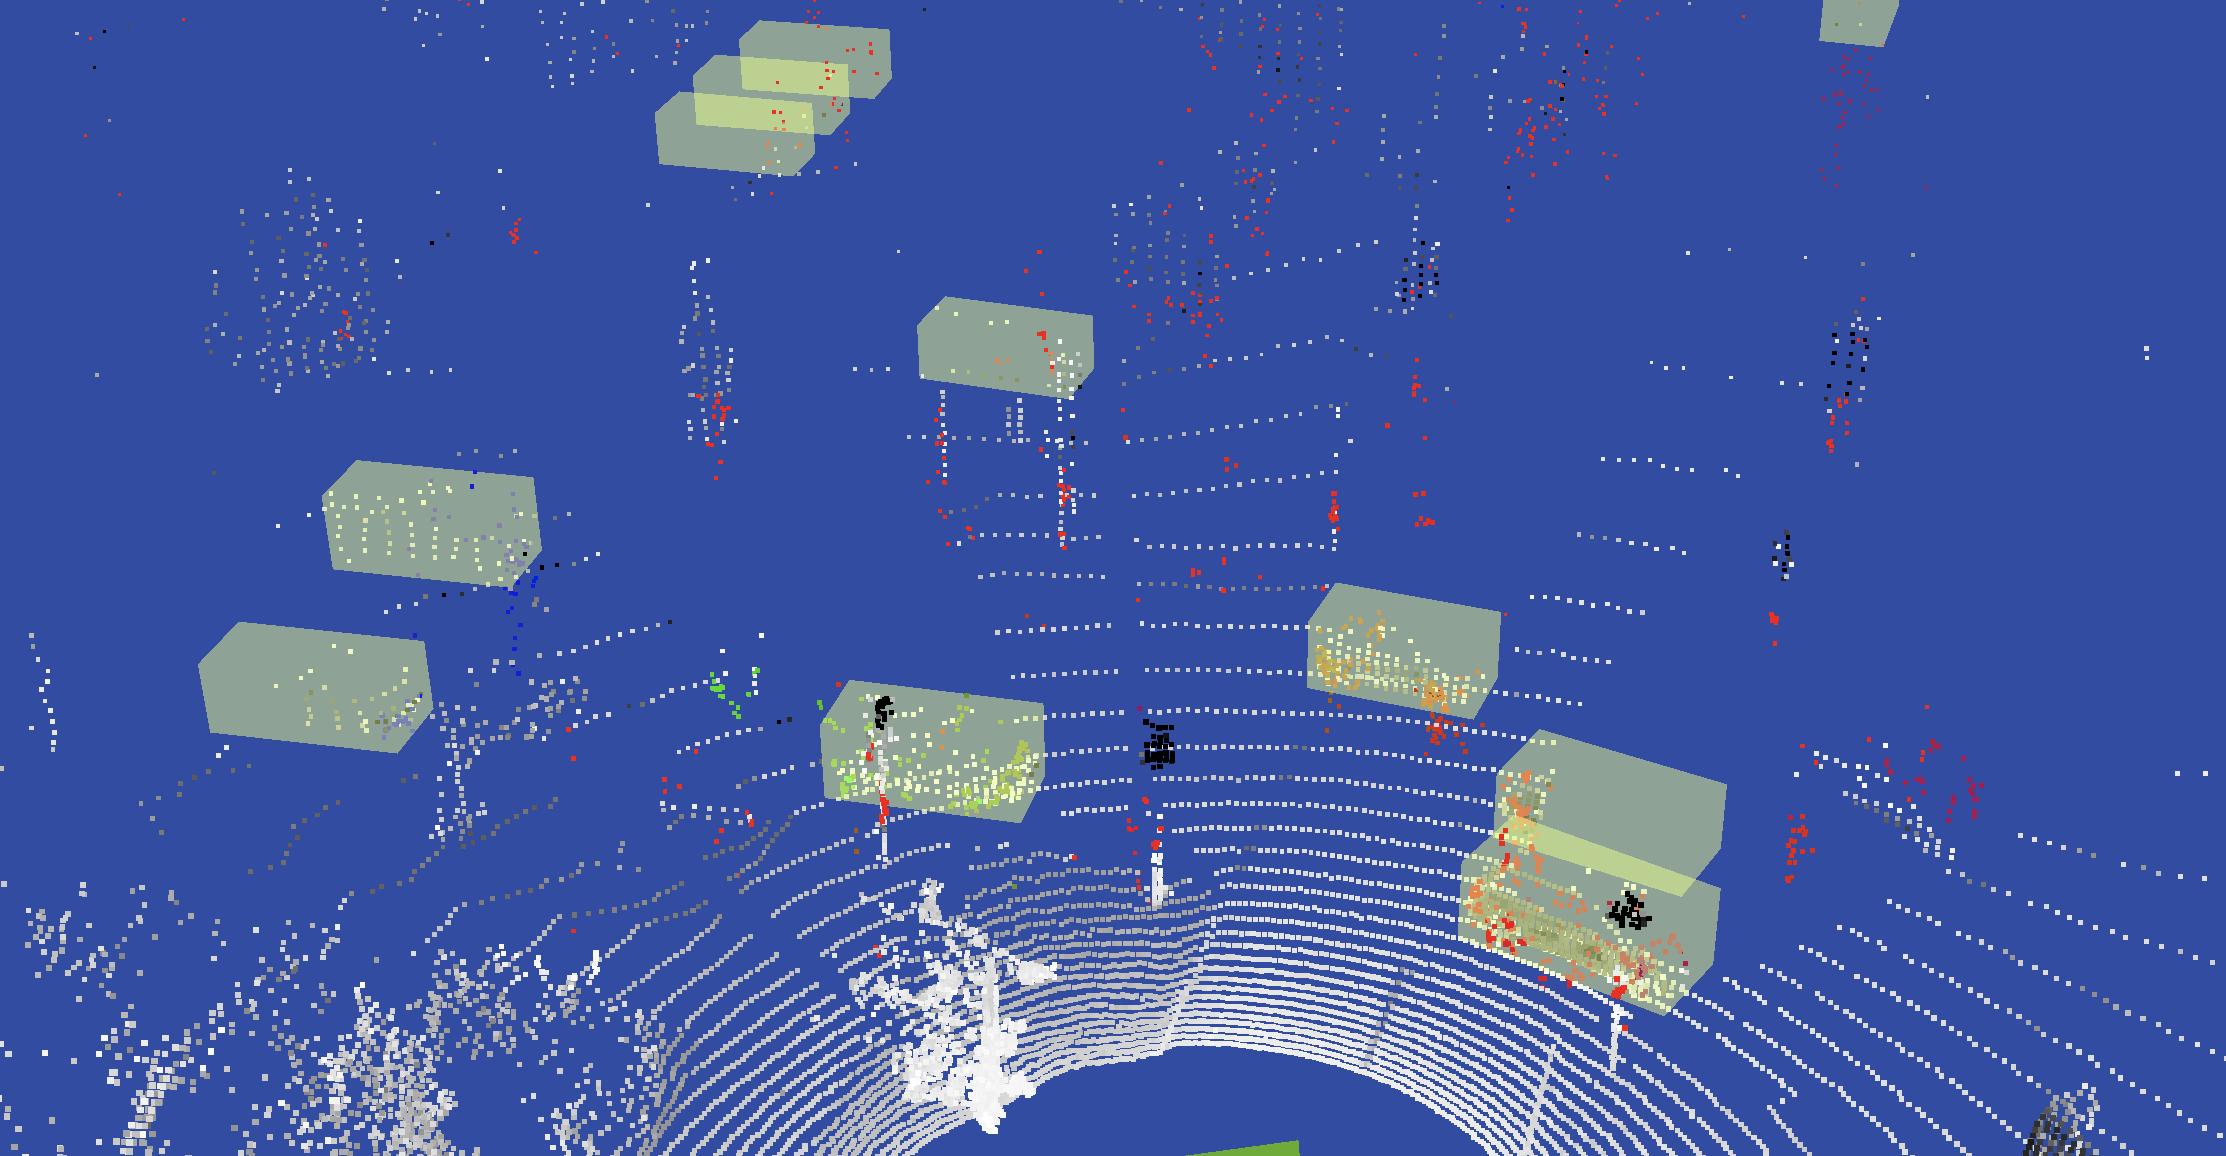
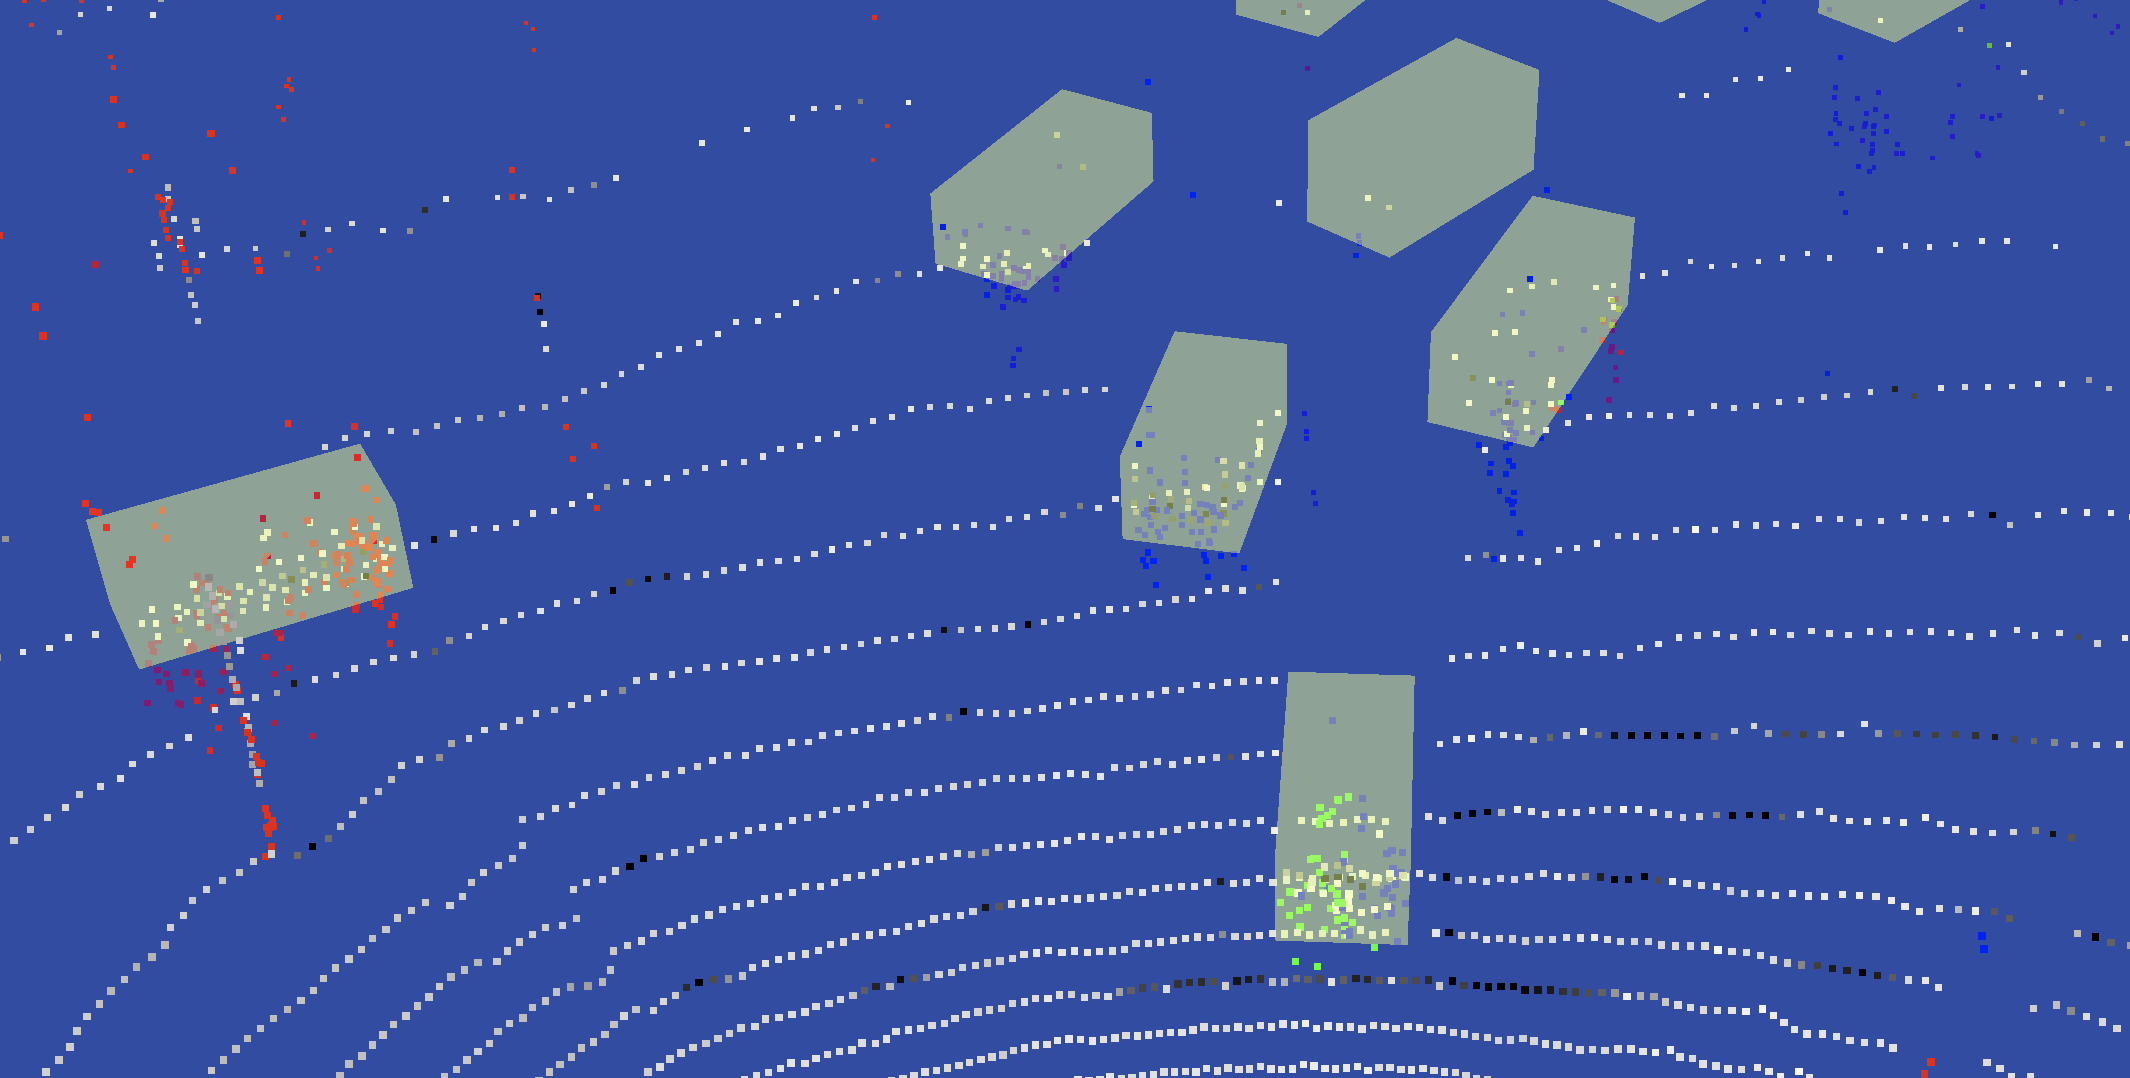
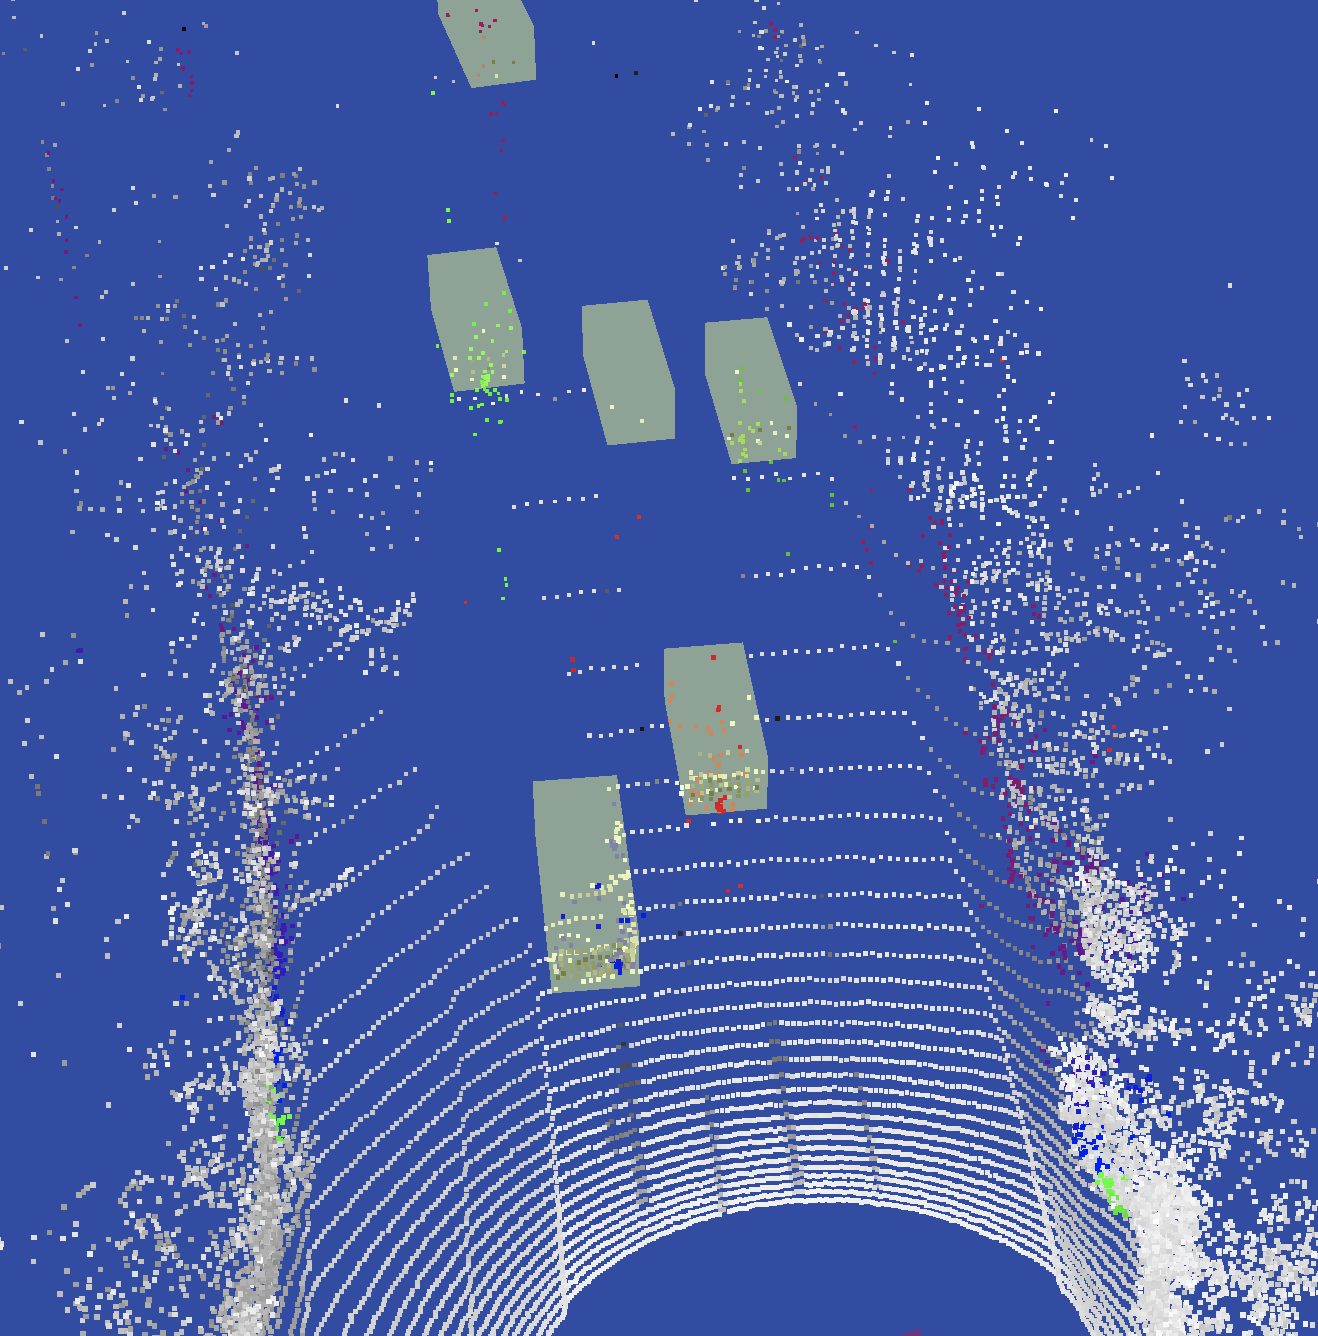

Now that we visualise both lidar and radar frames we can reason about how you can use this for a self-driving car. Although the resolution of the radar is high compared to other radars the lidar sensor still gives more points per objects close to us. With only lidar you can still see what kind of object something is (traffic light, car, pedestrian) while this is harder based on only this radar data. However, at further distances the radar really starts to shine. Objects that are farther away have more hits by the radar than by the lidar. There are also some cars which don’t get hit by the lidar at all, but the radar makes it clearly visible that there is a car there. What’s also really nice is that radar allows you to better estimate whether something is moving or not. For self-driving cars non-moving (static) objects don’t pose any risk, as long as you don’t drive into them. However, moving objects, regardless of what they actually are, require extensive attention to figure out what they are, what they will likely do, and require the car to plan a path around them. In the visualisation you can find some objects which only have a few hits by the lidar, but the radar shows that they are moving, and thus are important for the self-driving car.
Hopefully you learned a bit more about lidar and radar by looking at this visualisation. If you don’t have a VR set: please let me know when you are in Munich so you can see the visualisation at my place. A big thanks to Cruise/Astyx for providing the data, it was loads of fun to play with.